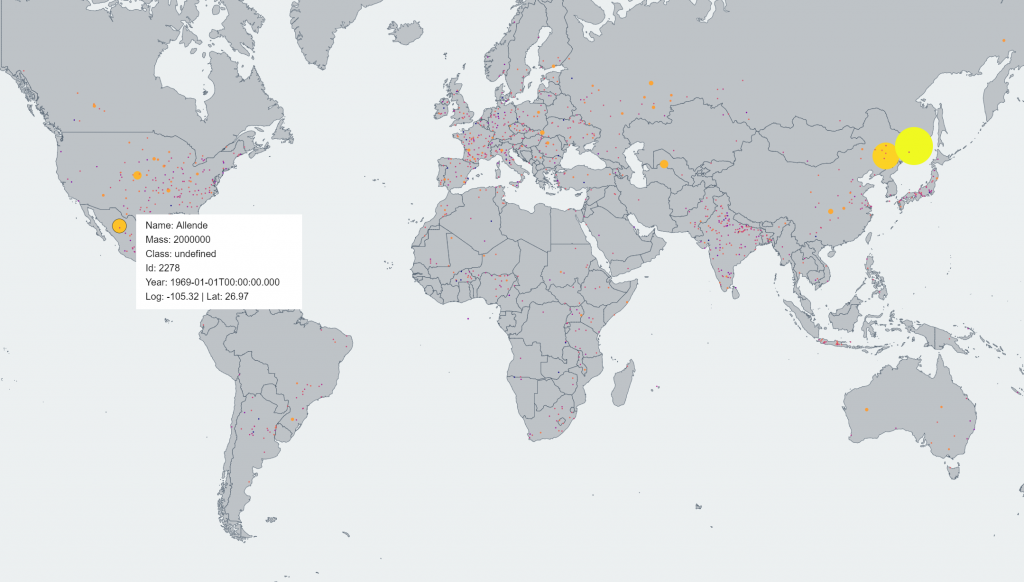
Meteor World Map
Represents meteor impact recordings across the globe, each hit represented as a point of varying size and colour, corresponding to its mass. Allows users to hover each point to view more information. Data is provided by a TOPOJSON API and is scalable in that the size variations are evened out by a logarithmic function.

USA Education Data Choropleth
A choropleth map of all counties in the US representing the portion of the population with a Bachelors degree or higher.
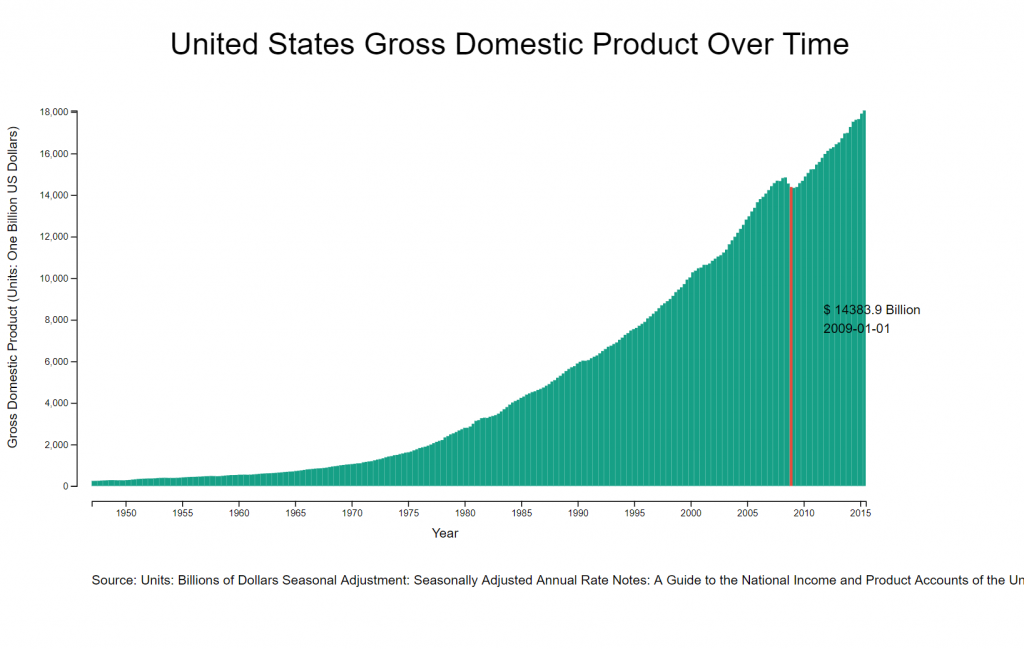
GDP Interactive Bar Chart
A simple bar chart with a hover tooltip created to map US gross domestic product from a JSON API.
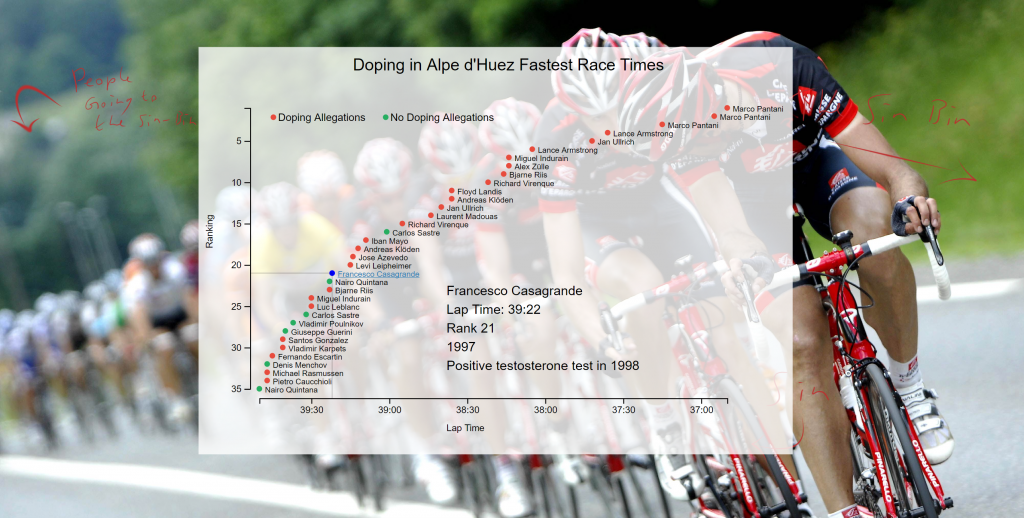
Scatter Plot Graph
An interactive, time-based scatter plot graph rendering static data for doping statistics for the Alpe d’Huez fastest race times, served from a static JSON file.